
 | : Is Urbanization Increasing Flood Risk? An Ontario Assessment |
by
N. Nirupama
Assistant Professor, Applied Disaster & Emergency Studies,
Brandon University, Brandon, Manitoba R7A 6A9, Canada.
Email: nirupama@brandonu.ca
and
Slobodan P. Simonovic
Professor and Chair, Institute for Catastrophic Loss Reduction and the Department
of Civil & Environmental Engineering,
University of Western Ontario, London, Ontario, N6A 5B9, Canada.
Email: ssimonovic@fes.engga.uwo.ca,
Tel: +1-519-661-4271
Are we allowing an increased flood risk due to the rising number of habitats around our existing cities? The present study is an attempt to answer this question by understanding and establishing a relationship between ever increasing urban development and river flows. The remote sensing technique has been used to quantify the actual increase in urban area over the past three decades. The Upper Thames River watershed in southwestern Ontario, Canada, has been chosen as the study area for this work. The Canadian city of London, in the Upper Thames River watershed, has been expanding at an exponential rate over the decades. By analysing the temporal satellite imageries and the observed meteorological and hydrologic data of the catchment, the authors are able to successfully establish the concern for increasing river flows due to urbanization. Based on this study, we can positively infer that fast urbanization will increase the vulnerability of a region. The urbanization vs. river flows relationship will also help in predicting future trend of river flows. The results of this study will encourage emergency managers and local planning authorities to consider land use planning as an effective non-structural measure for flood risk mitigation.
Keywords: Remote sensing, non-structural flood protection, land use planning, flood management, flood mitigation, GIS.
Introduction
A sudden increase in river flows might cause floods in the surrounding region, and the stakeholders are not only the flood control managers and people living in the region but also insurance agencies who provide insurance against natural hazard damages.
The dynamism of nature is hard to understand even today. Among various natural phenomena, we get rainfall, snow and four seasons that keep varying the temperatures, soil moisture and humidity. In case of rain, rainwater saturates the soil, depending on the intensity and duration of rain, before forming any overland flow and, in case of snow, when the temperature rises, accumulated snow starts building up an overland flow that finally reaches the drainage channels. Floods are the result of excess runoff, which could increase or decrease, depending on various factors such as intensity of rainfall, snowmelt, soil type, soil moisture conditions, topology, and land use. Runoff from rural and urban areas is generally a response of excess water after the processes of infiltration and evapotranspiration have taken place. Obviously, urban regions will have more impervious surface where infiltration cannot occur. On the other hand, rural drainage areas will have some water absorbed in the soil till it reaches saturation level and sends the rest to contribute to direct runoff. Soil erosion, too, is greatly controlled by vegetation. Dense vegetation provides vegetal retardance to overland flow. Hence land use classes, as determined by remote sensing techniques, have an implicit hydrological significance in terms of water yield, peak flows and soil erosion (Gorte, 2000). Vegetation delays direct runoff from high intensity rainfalls in smaller catchments (Bruynzeel, 1990). Continuing deforestation leads to more sediment yield downstream, which causes damages in floodplain agricultural fields (Meijerink and Maathuis, 1997).
Knowing that excess precipitation can influence the overland flow and river flows for the worse in normal conditions, what will happen if land use in the watershed changes dramatically? To explore the possibility of finding a relationship between urbanization and river flows that might lead to floods, remote sensing technique can be very useful.
Since the first Earth Resource satellite, Landsat-1, was launched in 1972, we have come a long way in terms of improved sensors with better spatial and temporal resolutions. Different satellites and sensors can provide unique information about properties of the surface or shallow layers (viz., top soil layer) of the Earth. For example, measurements of the reflected solar radiation give information on albedo (fraction of light that is reflected by a body or surface), thermal sensors measure surface temperature, and microwave sensors measure the dielectric properties and hence, the moisture content of surface soil (Portmann and Mendel, 1997, Rombach and Mauser, 1997) or of snow.
According to the Munich Re Group, floods are most frequent and widespread of all natural disasters in the world. Within the year 2001 there have been 17 flood events recorded with more than 2372 fatalities and more than $3.5 billion in economic losses. Scientists and researchers have been investing valuable hours and funds in finding more accurate and faster methodologies to predict and estimate flood damages. Satellite imagery can be very effective for flood management in the following ways:
Detailed mapping approach that is required for the production of hazard assessment maps and for input to various types of hydrological models (Brakenridge et al, 1998, Townsend and Walsh, 1998, Okamoto et al, 1998, Borneman, 1988, Saatchi et al, 2000).
A larger scale approach that looks at the general flood situation within a river catchment or coastal belt with the aim of identifying areas at greatest risk and in the need of immediate assistance. This will also provide valuable input to insurance industry.
Land use/cover changes over the years to quantify prominent changes in land use/cover in general and extent of impervious area in particular.
Quantitative Precipitation Estimates (QPE) and Forecasts (QPF) information from satellite to facilitate flood and flash flood forecasts (URL: http://www.dsaster.ceos.org).
Clouds patterns (Pankiewicz, 1997, Feidas et al, 2000).
Through snow monitoring and estimation of Snow Water Equivalent (Schjodt-Osmo and Engeset, 1997).
This study focuses on establishing a relationship between impervious area and river flows using remote sensing technique. Findings from this study can be used to form policies on land use planning and balanced urbanization by the city development, planning and conservation authorities, flood control agencies, and emergency managers. Once the affect of urbanization on river flows is quantified, the future trend would become possible to predict so that measures to cope with increasing demand for residential/commercial areas can be met without risking the increased intensity and extent of storm water in rainy and snowmelt periods.
In order to validate the argument discussed above, and to establish a relationship between urbanization and river flows, a case study of the Upper Thames River (UTR) watershed in southern Ontario has been carried out. Findings of the case study are given in the following sections.
Case Study
Description of study area
Upper Thames River (UTR) watershed (Figure 1), which is the second largest in southwestern Ontario, is in Canada. Total area of the watershed is 3482 km2, which falls within the central meridian of 81W, Zone 17 and length of drainage basin is 200 km covering the north and south branches of the Thames River (http://www.thamesriver.on.ca).
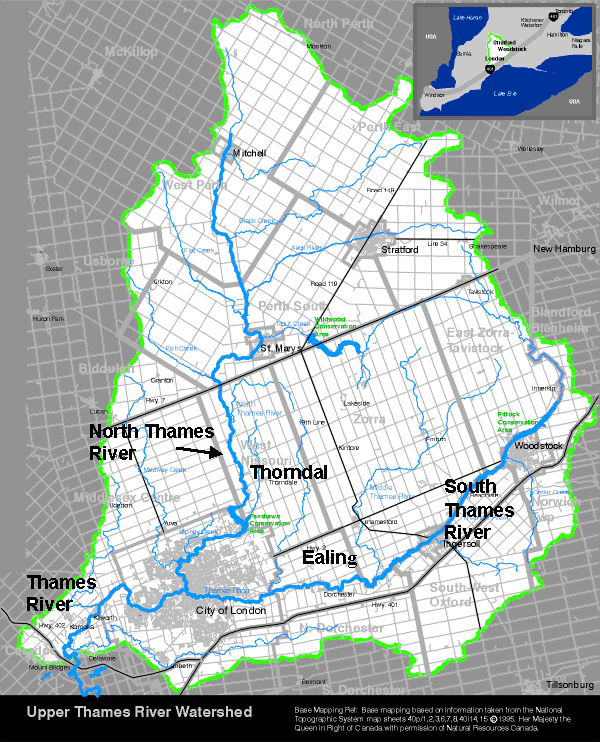
Figure 1: Upper Thames River Watershed
UTR Conservation Authority (UTRCA) takes up the task of flood control, preservation of agricultural lands, improved forestry management practices, water quality upgrading and other considerations which are important for ecosystem upkeep (UTRCA, 1994). The watershed is mainly rural except for the larger urban centers of London, Stratford and Woodstock and has a population of over 400,000. The city of London, which is experiencing net migration trends similar to those for Metropolitan Toronto, has been chosen for this study. Over last three decades (1971 to 2001) the population of London has gone up by approximately 43%, and is expected to go up by a total of 67% by the year 2026 (UTRCA, undated). The industrial sector within the watershed is based around automotive assembly and supply, aggregate extraction for the construction industry, and agricultural based industries. Agriculture is the main component of the landscape with approximately 3,600 farms, including over 2,000 livestock operations. The Thames River is much more responsive to climate changes than the larger Great Lakes area. Precipitation, or lack of it, can quickly cause conditions to change in the Thames River watershed. For example, stream flows were greatly reduced in the Thames River watershed in 1998 and 1999 causing many watercourses to dry up completely. The rate of runoff into the two branches of the Thames River is quite high and the risk of floods due to extreme storm events or during spring break-up, which are frequent and most severe, is very high. The impervious clay soils, the high gradient of the riverbed, and the steep lateral slopes of the tributaries increase the rate of runoff (UTRCA publication, 1955).
There are 26 hydrologic observation stations, managed by Environment Canada, in the UTR watershed, out of which about 10 observation stations are on or near the Thames River. Hydrologic measurements at Thorndale (upstream inlet point) and Byron (downstream outlet point), as illustrated in Figure 1, have been used in this study. The north branch of the Thames River is regulated by Fanshaw dam (since 1952), which is located north of the City of London and downstream of Thorndale. Thorndale hydrologic measurement station records unregulated inflow into Fanshaw reservoir. Therefore, river flows at Thorndale are being used for analyzing the observed river flow time series. On the south branch of the Thames River, Pittock reservoir (since 1965) does not affect the flows at Ealing (Figure 1) observation station because it is quite far upstream from London. Byron measurement station, which is located south of London where the flow is measured and used in this study, can be considered the outlet point for the entire watershed. Total precipitation time series at London, managed by Environment Canada, has been used for the analysis purpose in this study because the affect of urbanization in London is the main focus here.
Remote sensing provides us with enormous opportunities to carry out land use change observations on a temporal basis. This method is efficient, accurate and less time consuming. Besides, large areas can be observed with ability to update the database within hours. Satellite coverage are available through data collection agencies for a subsidised cost for research purposes.
For the present study, three imageries of Landsat satellites covering the UTR watershed were acquired over the time period of 1974 to 2000. These imageries are Landsat-1 MSS (Multi Spectral Scanner) of July 7, 1974, Landsat-4 MSS of September 30, 1983, and Landsat-7 ETM+ (Enhanced Thematic Mapper) of October 30, 2000. To be able to see the details in satellite imageries more clearly, MSS imagery of Landsat-1 was converted into colour composite of bands 2 (0.6 - 0.7µm), 3 (0.7 - 0.8µm) and 4 (0.8 - 1.1µm), Landsat-4 imagery was converted into colour composite of bands 2 (0.52 - 0.6µm), band 3 (0.63 - 0.69µm) and band 4 (0.76 - 0.9µm) and ETM imagery of Landsat-7 was converted into a colour composite of bands 3 (0.63 - 0.69µm), 4 (0.76 - 0.9µm) and 5 (1.55 - 1.75µm). Spectral resolution of Landsat-1 and 4 MSS imagery is 80 m and that of Landsat-7 ETM imagery is 30 m, therefore, the different land use classes are more clearly visible in Landsat-7 imagery compared to Landsat-1 and 4 imageries.
Maximum Likelihood Supervised Classification technique was used to classify the three imageries. The Maximum Likelihood method is based on Bayesian probability theory. It uses the mean and variance/covariance of signatures to estimate the posterior probability that a pixel belongs to each class. Maximum Likelihood procedure accounts for inter-correlation between bands, therefore, the information about the covariance between bands as well as their inherent variance is included thus producing elliptical zone of characterization of the signature. In fact, it calculates the posterior probability of belonging to each class, where the probability is highest at the mean position of the class and falls off in an elliptical pattern away from the mean, as shown in Figure 2 (Eastman, 2001).
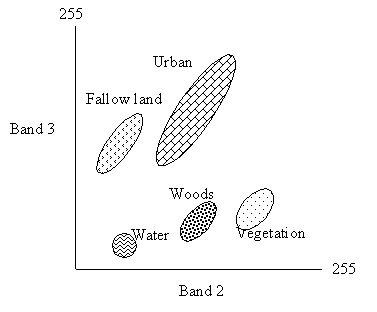
Figure 2: Maximum Likelihood Supervised Classified procedure
The three imageries were classified in seven land use categories, such as, woods, row crops and legume grasses, small grain or grasses, fallow land, urban/city, homestead and open water bodies. These land use classes coincide with the UTRCA’s standard land use classes. Results of the classification carried out on Landsat-1, 4 and 7 imageries are given in Figures 3, 4 and 5. Details of land use classes and their corresponding areas are given in Table 1.
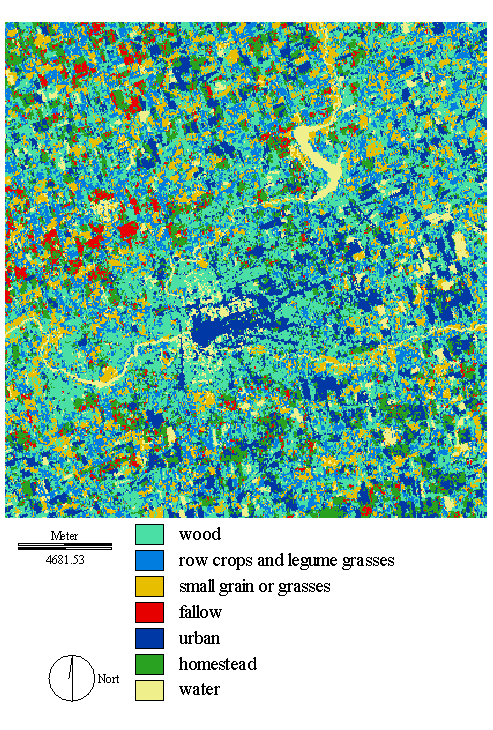
Figure 3: LANDSAT 1 Imagery of July 1974 classified for land use
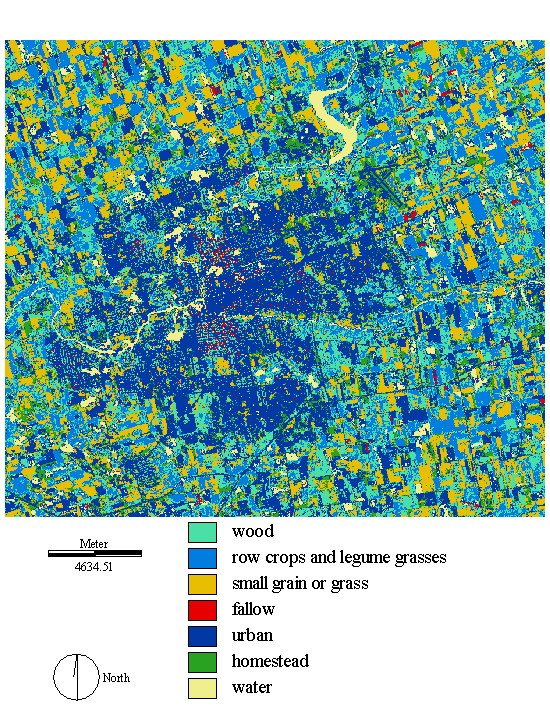
Figure 4: LANDSAT 5 Imagery of July 1990 classified for land use
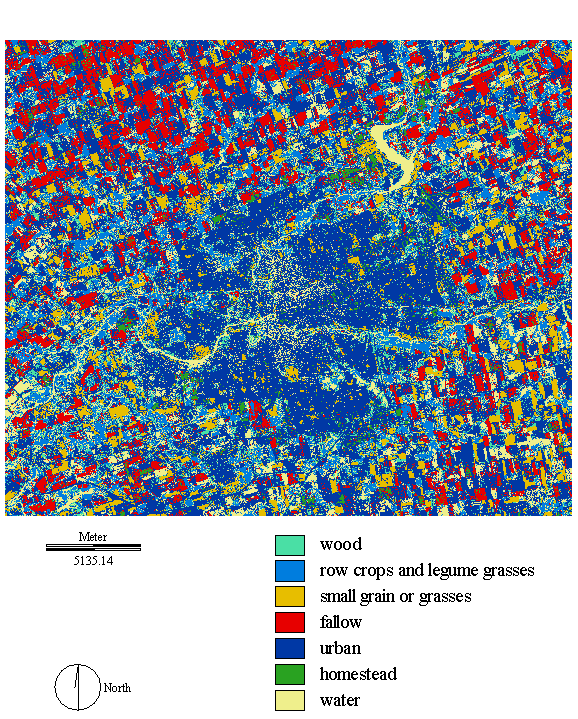
Figure 5: LANDSAT 7 Imagery of October 2000 classified for land use.
Table 1: Land Use Classification Results for LANDSAT-1, 5 and 7 Images
| Land Use Classes |
LANDSAT-1 MSS Jul 7, 1974 (Percent) |
LANDSAT-5 TM Jul 23, 1990 (Percent) |
LANDSAT-7 ETM Oct 30, 2000 (Percent) |
|
Woods |
24.01 |
11.98 |
13.06 |
|
Row Crops & Legume Grasses |
22.78 |
29.18 |
13.20 |
|
Small Grains or Grass |
31.56 |
34.91 |
16.84 |
|
Fallow Land |
4.79 |
2.34 |
30.06 |
|
Urban |
10.07 |
16.72 |
22.25 |
|
Homestead |
3.14 |
2.05 |
1.86 |
|
Water |
3.65 |
2.82 |
2.73 |
Hydrologic Data Analysis
Observed total precipitation (rain and snow) and river discharge measurements were plotted to illustrate the actual changing trend of peak flows during the years 1970 to 1997. As shown in Figure 1, Thorndale is located upstream of London and Byron is located south of London at the outlet of the UTR watershed. The differences in peak flows between Thorndale and Byron, when plotted (Figure 6), show a mixed pattern over the years.
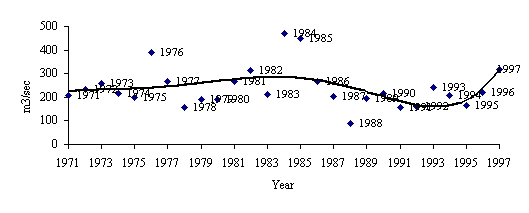
Figure 6: Plot of differences in observed peak flows at Thorndale and
Byron
Figure 7 - 9 are plots of observed flows at Thorndale and Byron and total precipitation at London plotted together to provide an understanding of the flow response to total precipitation, which occurred during each particular year. 1970 hydrographs at Byron and Thorndale, in Figure 7, plotted against total precipitation, indicate a peak flow of about 300 m3/s for a total precipitation of about 400 mm. In 1993 (Figure 8), January precipitation alone brought an instant high peak of more than 700 m3/s. In 1997 (Figure 9), too, despite the total precipitation being as low as below 200 mm during the beginning of the year there are instant high flows of more than 800 m3/s at that time.
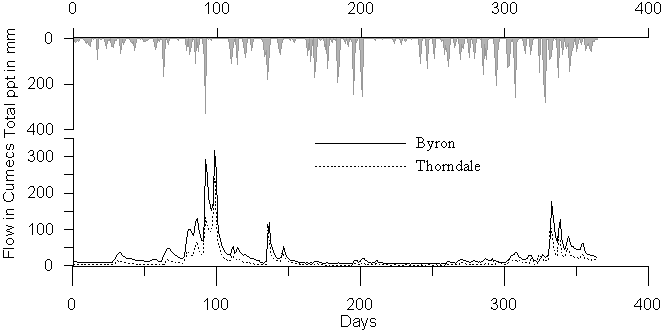
Figure 7: 1970 observed hydrographs at Byron and Thorndale and total precipitation at London
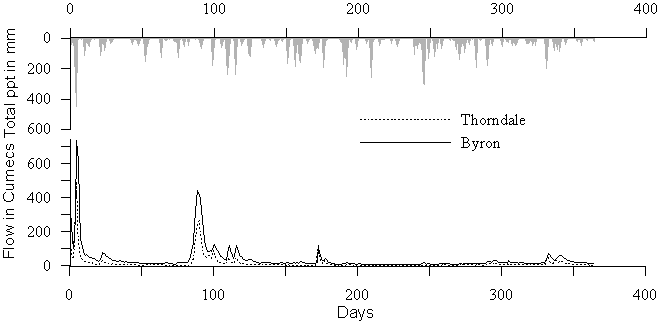
Figure 8: 1993 observed hydrographs at Byron and Thorndale and total precipitation at London
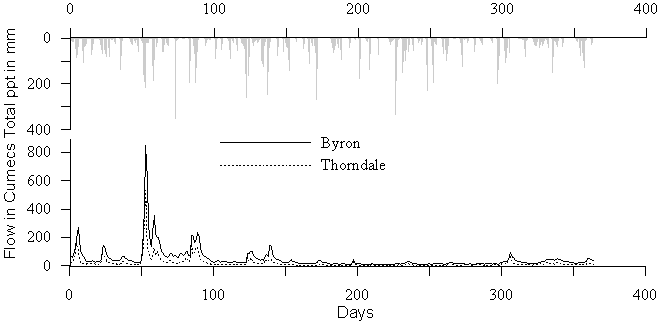
Figure 9: 1997 observed hydrographs at Byron and Thorndale and total precipitation at London
It is clear from the values given in the Table 1 that tremendous urban development has taken place over three decades amounting to 22.25% urban region in 2000 as compared to only 10.07% in 1974. Areas covered by woods came down to 11.98% in 1990 but rose again to 13.06% in 2000. There is also a very significant difference in the percentage of row crops and legume grasses and small grains or grasses. Fallow land percentage is varying due to the different time of image acquisition of LANDSAT 5 and 7. Also, homestead percentage drops from 3.14% in 1974 to 1.86% in 2000. The difference in water availability over three decades can be noticed as well.
Figure 7 indicates a peak flow of about 300 m3/s for a total precipitation of about 400 mm, which means that the river flow was not as high as in the 90s for the same amount of total precipitation. In 1993 (Figure 8) January precipitation brought an instant high peak of more than 700 m3/s, which forces us to believe that the effect of urbanization in and around London, Ontario, could be the reason for such quick and high runoff. In 1997 (Figure 9), too, despite the total precipitation being as low as below 200 mm during the beginning of the year, there are instant high flows of more than 800 m3/s. This further strengthens the concern for increased river flows intensity and reduced time for overland flow to reach the drainage channels.
Cropping is a dynamic process, which keeps changing several times in a year. Unfortunately, due to cloud cover limitations, the period of the three remote sensing imageries does not match; therefore, not much can be discussed about the crops, small grains and fallow land classes. Vast areas of woods have been cleared for urban development in and around the City of London in the UTR watershed. The number of homesteads has reduced considerably. Considering the awareness regarding conserving the forests that came into effect in late 70s (UTRCA, 1975), the rise in dense forested area is a positive sign.
Conclusion
There is no doubt that over the last three decades enormous urban sprawls have cropped up everywhere in general. Due to increased impervious area in the UTR watershed (18% in 1974 to 35.6% in 2000) precipitation responds quickly, reducing the time to peak and producing higher peak flows in the drainage channels. This pattern of high flows, that assumes the peak flow with a considerably reduced ‘time to peak’, has been illustrated in the hydrographs plotted using observed hydrologic and meteorological time series.
Conventionally, flood control works and emergency managers respond to crises as and when they occur rather than addressing the broader issues such as preventive measures, reducing risk and vulnerability (Shrubsole, 2001). It is time to weigh other alternatives for mitigation of flood damages, landslides, soil erosion, and other hazards. Planned land use is definitely a successful way to go. If planning of urban development is done carefully and inference of this study taken into account, losses due to floods can be mitigated to a great extent. New policies can be brought into effect to balance the urban and industrial development as a measure to keep the direct runoff under control and hence mitigating the chances of occurrences of floods during high intensity storms.
The funding from the Natural Sciences and Engineering Research Council of Canada (NSERC) and Institute for Catastrophic Loss Reduction (ICLR) is thankfully acknowledged. Environment Canada and UTRCA helped with the data.
Brakenridge, G.R., Tracy, B.T. and Knox, J.C. (1998). "Orbital SAR Remote Sensing of a River Flood Wave." Int. J. Rem. Sen., 19(7), 1439-1445.
Borneman, R. (1988). "Satellite Rainfall Estimating Program of NOAA/NESDIS Satellite Analysis Branch." National Weather Digest, 13(2), 7-15.
Bruynzeel, L.A. (1990). Hydrology of moist tropical forests and effects of conversion: a state of knowledge review. UNESCO, 224.
Eastman, J.R. (2001) Guide to GIS and Image Processing Volume 2, Idrisi Manual version 32.20, 65.
ERDAS Field Guide, 1991, Second Edition, Version 7.5.
Feidas, H.N., Cartalis. C. and Cracknell, A.P. (2000). "Use of Meteosat Imagery to Define Clouds Linked with Floods in Greece." Int. J. Rem. Sen., 21(5), 1047-1072.
Gorte, B.G.H. (2000). "Land-use and Catchment Characteristics" in Remote Sensing in Hydrology and Water Management, edts., Shhultz, G.A. and Engman, E.T., Springer, 133-156.
Meijerink, A.M.J. and Maathuis, B. H.P. (1997). Use of Remote Sensing to assess flood damage to rice lands caused by accelerated erosion and neo-tectonics, Komering River, Sumatra. River Flood Disasters. Proc. ICSU SC/IDNDR. IHP/OHP-Berichte, Sonderheft 10, Koblenz, pp. 97-105.
Okamoto, K., Yamakawa, S. and Kawashima, H. (1998). "Estimation of Flood Damage to Rice Production in North Korea in 1995." Int. J. Rem. Sen., 19(2), 365-371.
Pankiewicz, G.S. (1997). "Neural Network Classification of Convective Airmasses for a Flood Forecasting System." Int. J. Rem. Sen., 18(4), 887-898.
Portmann, F. and Mendel, H.G. (1997) "Soil moisture estimation in hydrological mesoscale modelling using ERS-SAR data." Third ERS Symposium on Space at the service of our Environment, Florence, Italy, 14-21 March.
Rombach, M., and Mauser, W. (1997) "Multi-annual analysis of ERS surface soil moisture measurements of different land uses", 3rd ERS Symposium, Florence, Italy, 14-21 March.
Schjødt-Osmo and Engeset (1999). "Remote Sensing and Snow Monitoring: Application to Food Forecasting." (< http://webben.nve.no/hydrologi/bre/remote/ewra97.html>).
Saatchi, S.S., Nelson, B., Podest, E. and Holt, J. (2000). "Mapping Land Cover Types in the Amazon Basin Using 1km JERS-1 Mosaic." Int. J. Rem. Sen., 21(6), 1201-1234.
Shrubsole, D. (2001) "The cultures of flood management in Canada: Insights from the 1997 Red River experience." Canadian Water Resources Journal, 26(4), 461-479.
Townsend, P.A. and Walsh, S.J. (1998). "Modeling Floodplain Inundation Using and Integrated GIS with Radar and Optical Remote Sensing." Geomorphology, 21(1998)295-312.
UTRCA publication, 1955, Brief on flood control measures for the Upper Thames Watershed.
UTRCA publication, 1994, Strategic plan, Upper Thames River Conservation Authority.
UTRCA publication, 1975, London valley lands study.
UTRCA publication, Population projections for the Upper Thames Basin.